Ficheru:StationaryStatesAnimation.gif

Contenido de la página no disponible en otros idiomas.
De Wikipedia

StationaryStatesAnimation.gif(300 × 280 píxels, tamañu de ficheru: 223 kB, triba MIME: image/gif, animáu, 41 cuadros)

Esti ficheru ye de Wikimedia Commons y puen usalu otros proyeutos. La descripción de la páxina de descripción del ficheru s'amuesa darréu.

Resume

Descripción
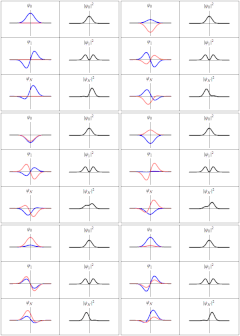
English: Three wavefunction solutions to the Time-Dependent Schrödinger equation for a harmonic oscillator. Left: The real part (blue) and imaginary part (red) of the wavefunction. Right: The probability of finding the particle at a certain position. The top two rows are the lowest two energy eigenstates, and the bottom is the superposition state , which is not an energy eigenstate. The right column illustrates why energy eigenstates are also called "stationary states".
Thus in every quantum stae,there are certain preferred positions of maximum probability
Data
Fonte Trabayu propiu
Autor Sbyrnes321
(* Source code written in Mathematica 6.0 by Steve Byrnes, Feb. 2011. This source code is public domain. *)
(* Shows classical and quantum trajectory animations for a harmonic potential. Assume m=w=hbar=1. *)
ClearAll["Global`*"]
(*** Wavefunctions of the energy eigenstates ***)
psi[n_, x_] := (2^n*n!)^(-1/2)*Pi^(-1/4)*Exp[-x^2/2]*HermiteH[n, x];
energy[n_] := n + 1/2;
psit[n_, x_, t_] := psi[n, x] Exp[-I*energy[n]*t];
(*** A non-stationary state ***)
SeedRandom[1];
psinonstationary[x_, t_] := (psit[0, x, t]+psit[1, x, t])/Sqrt[2];

(*** Put all the plots together ***)
SetOptions[Plot, {PlotRange -> {-1, 1}, Ticks -> None, PlotStyle -> {Directive[Thick, Blue], Directive[Thick, Pink]}}];
MakeFrame[t_] := GraphicsGrid[
   {{Plot[{Re[psit[0, x, t]], Im[psit[0, x, t]]}, {x, -5, 5}, PlotLabel -> Subscript[\[Psi],0]], 
     Plot[Abs[psit[0, x, t]]^2, {x, -5, 5}, PlotStyle -> Directive[Thick, Black],
		PlotLabel -> TraditionalForm[Abs[Subscript[\[Psi],0]]^2]]},
   {Plot[{Re[psit[1, x, t]], Im[psit[1, x, t]]}, {x, -5, 5}, PlotLabel -> Subscript[\[Psi],1]], 
     Plot[Abs[psit[1, x, t]]^2, {x, -5, 5}, PlotStyle -> Directive[Thick, Black],
		PlotLabel -> TraditionalForm[Abs[Subscript[\[Psi],1]]^2]]},
   {Plot[{Re[psinonstationary[x, t]], Im[psinonstationary[x, t]]}, {x, -5, 5}, PlotLabel -> Subscript[\[Psi],N]], 
     Plot[Abs[psinonstationary[x, t]]^2, {x, -5, 5}, PlotStyle -> Directive[Thick, Black],
		PlotLabel -> TraditionalForm[Abs[Subscript[\[Psi],N]]^2]]}
   }, Frame -> All, ImageSize -> 300];
output = Table[MakeFrame[t], {t, 0, 4 Pi*40/41, 4 Pi/41}];
SetDirectory["C:\\Users\\Steve\\Desktop"]
Export["test.gif", output]

Llicencia

Yo, el titular de los drechos d'autor d'esta obra, la espublizo baxo la siguiente llicencia:
Creative Commons CC-Zero Esti ficheru ta disponible baxo la llicencia Creative Commons de Dedicatoria universal al dominiu públicu CC0 1.0.
La persona qu'asoció una obra con esti documentu dedicó esa obra al dominiu públicu per aciu de la cesión mundial de los sos drechos baxo les lleis de drechos d'autor, incluyendo tolos los drechos llegales rellacionaos y axacentes, dientro del ámbitu permitíu pola llei. Pue copiar, camudar, distribuir y reproducir la obra, incluyendo con oxetivos comerciales, ensin pidir permisu.

Pies

Añade una explicación corta acerca de lo que representa este archivo

Elementos representados en este archivo

representa a

CC0 español

Historial del ficheru

Calca nuna fecha/hora pa ver el ficheru como taba daquella.

Data/HoraMiniaturaDimensionesUsuariuComentariu
actual18:21 20 mar 2011Miniatura de la versión a fecha de 18:21 20 mar 2011300 × 280 (223 kB)Sbyrnes321{{Information |Description ={{en|1=Three wavefunction solutions to the Time-Dependent Schrödinger equation for a harmonic oscillator. Left: The real part (blue) and imaginary part (red) of the wavefunction. Right: The probability of finding the partic

La páxina siguiente usa esti ficheru:

Usu global del ficheru

Estes otres wikis usen esti ficheru: