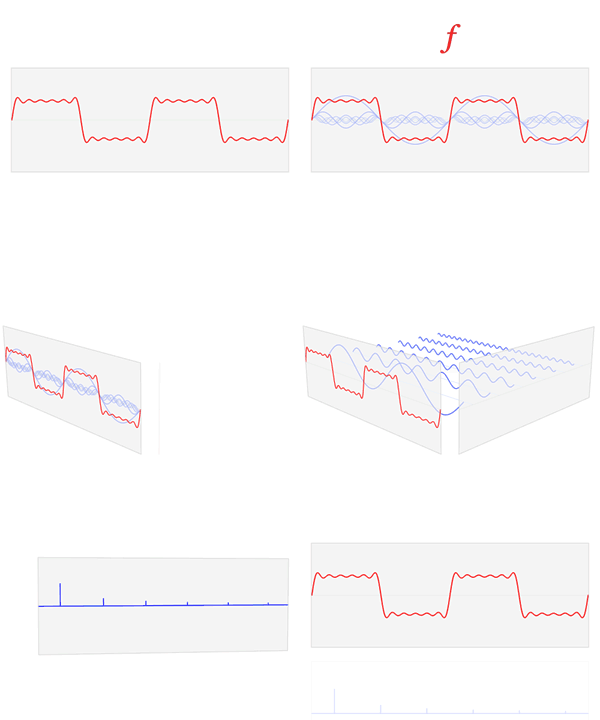
Ficheru:Fourier transform time and frequency domains (small).gif
Fourier_transform_time_and_frequency_domains_(small).gif (300 × 240 píxels, tamañu de ficheru: 265 kB, triba MIME: image/gif, animáu, 93 cuadros, 37s)
Historial del ficheru
Calca nuna fecha/hora pa ver el ficheru como taba daquella.
| Data/Hora | Miniatura | Dimensiones | Usuariu | Comentariu | |
|---|---|---|---|---|---|
| actual | 20:44 23 feb 2013 |  | 300 × 240 (265 kB) | LucasVB | {{Information |Description={{en|1=A visualization of the relationship between the time domain and the frequency domain of a function, based on its Fourier transform. The Fourier transform takes an input function f (in red) in the "time domain" and con... |
Usu del ficheru
La páxina siguiente usa esti ficheru:
Usu global del ficheru
Estes otres wikis usen esti ficheru:
- Usu en ar.wikipedia.org
- Usu en ca.wikipedia.org
- Usu en de.wikipedia.org
- Usu en el.wikipedia.org
- Usu en en.wikipedia.org
- Usu en en.wikibooks.org
- Usu en es.wikipedia.org
- Usu en es.wikibooks.org
- Usu en et.wikipedia.org
- Usu en fa.wikipedia.org
- Usu en fa.wikibooks.org
- Usu en he.wikipedia.org
- Usu en ja.wikipedia.org
- Usu en ko.wikipedia.org
- Usu en www.mediawiki.org
- Usu en mr.wikipedia.org
- Usu en ms.wikipedia.org
- Usu en nl.wikipedia.org
- Usu en pt.wikipedia.org
- Usu en pt.wikiversity.org
- Usu en ru.wikipedia.org
- Usu en simple.wikipedia.org
- Usu en sq.wikipedia.org
- Usu en tt.wikipedia.org
- Usu en uk.wikipedia.org
Ver más usos globales d'esti ficheru.


